
Whether there’s confetti still falling from your team’s last title or you’re waiting to see your first, you already have a gut feeling for how miserable you are as a fan. This project put a number on it.
What it is
An interactive fan-scoring model for ESPN that quantifies misery across the NFL, NBA, MLB, and NHL - 120+ teams, each scored 0–100 by an algorithm that weighs championship droughts, playoff heartbreaks, near-misses, and title highs. Pick your teams, get your misery score, argue with your friends about it. That last part is the feature.
How it works
- The scoring model blends decades of team history - droughts, collapses, championships, sustained futility - into one comparable number per team, so a Browns fan and a Jets fan can finally settle who’s suffered more with data.
- ArchieML editorial pipeline meant editors could tune copy and team blurbs in a Google Doc without touching the codebase - standard practice for keeping newsroom velocity out of the deploy cycle.
- Lottie animations carry the emotional beats - the tone of the piece is comedy-through-pain, and static charts weren’t going to land that.
- Built on React + TypeScript + Tailwind, shipped through ESPN’s feature-story stack.
Results
The piece did over 1M+ page views with 1+ minute average engagement - and took the top spot on ESPN’s homepage.
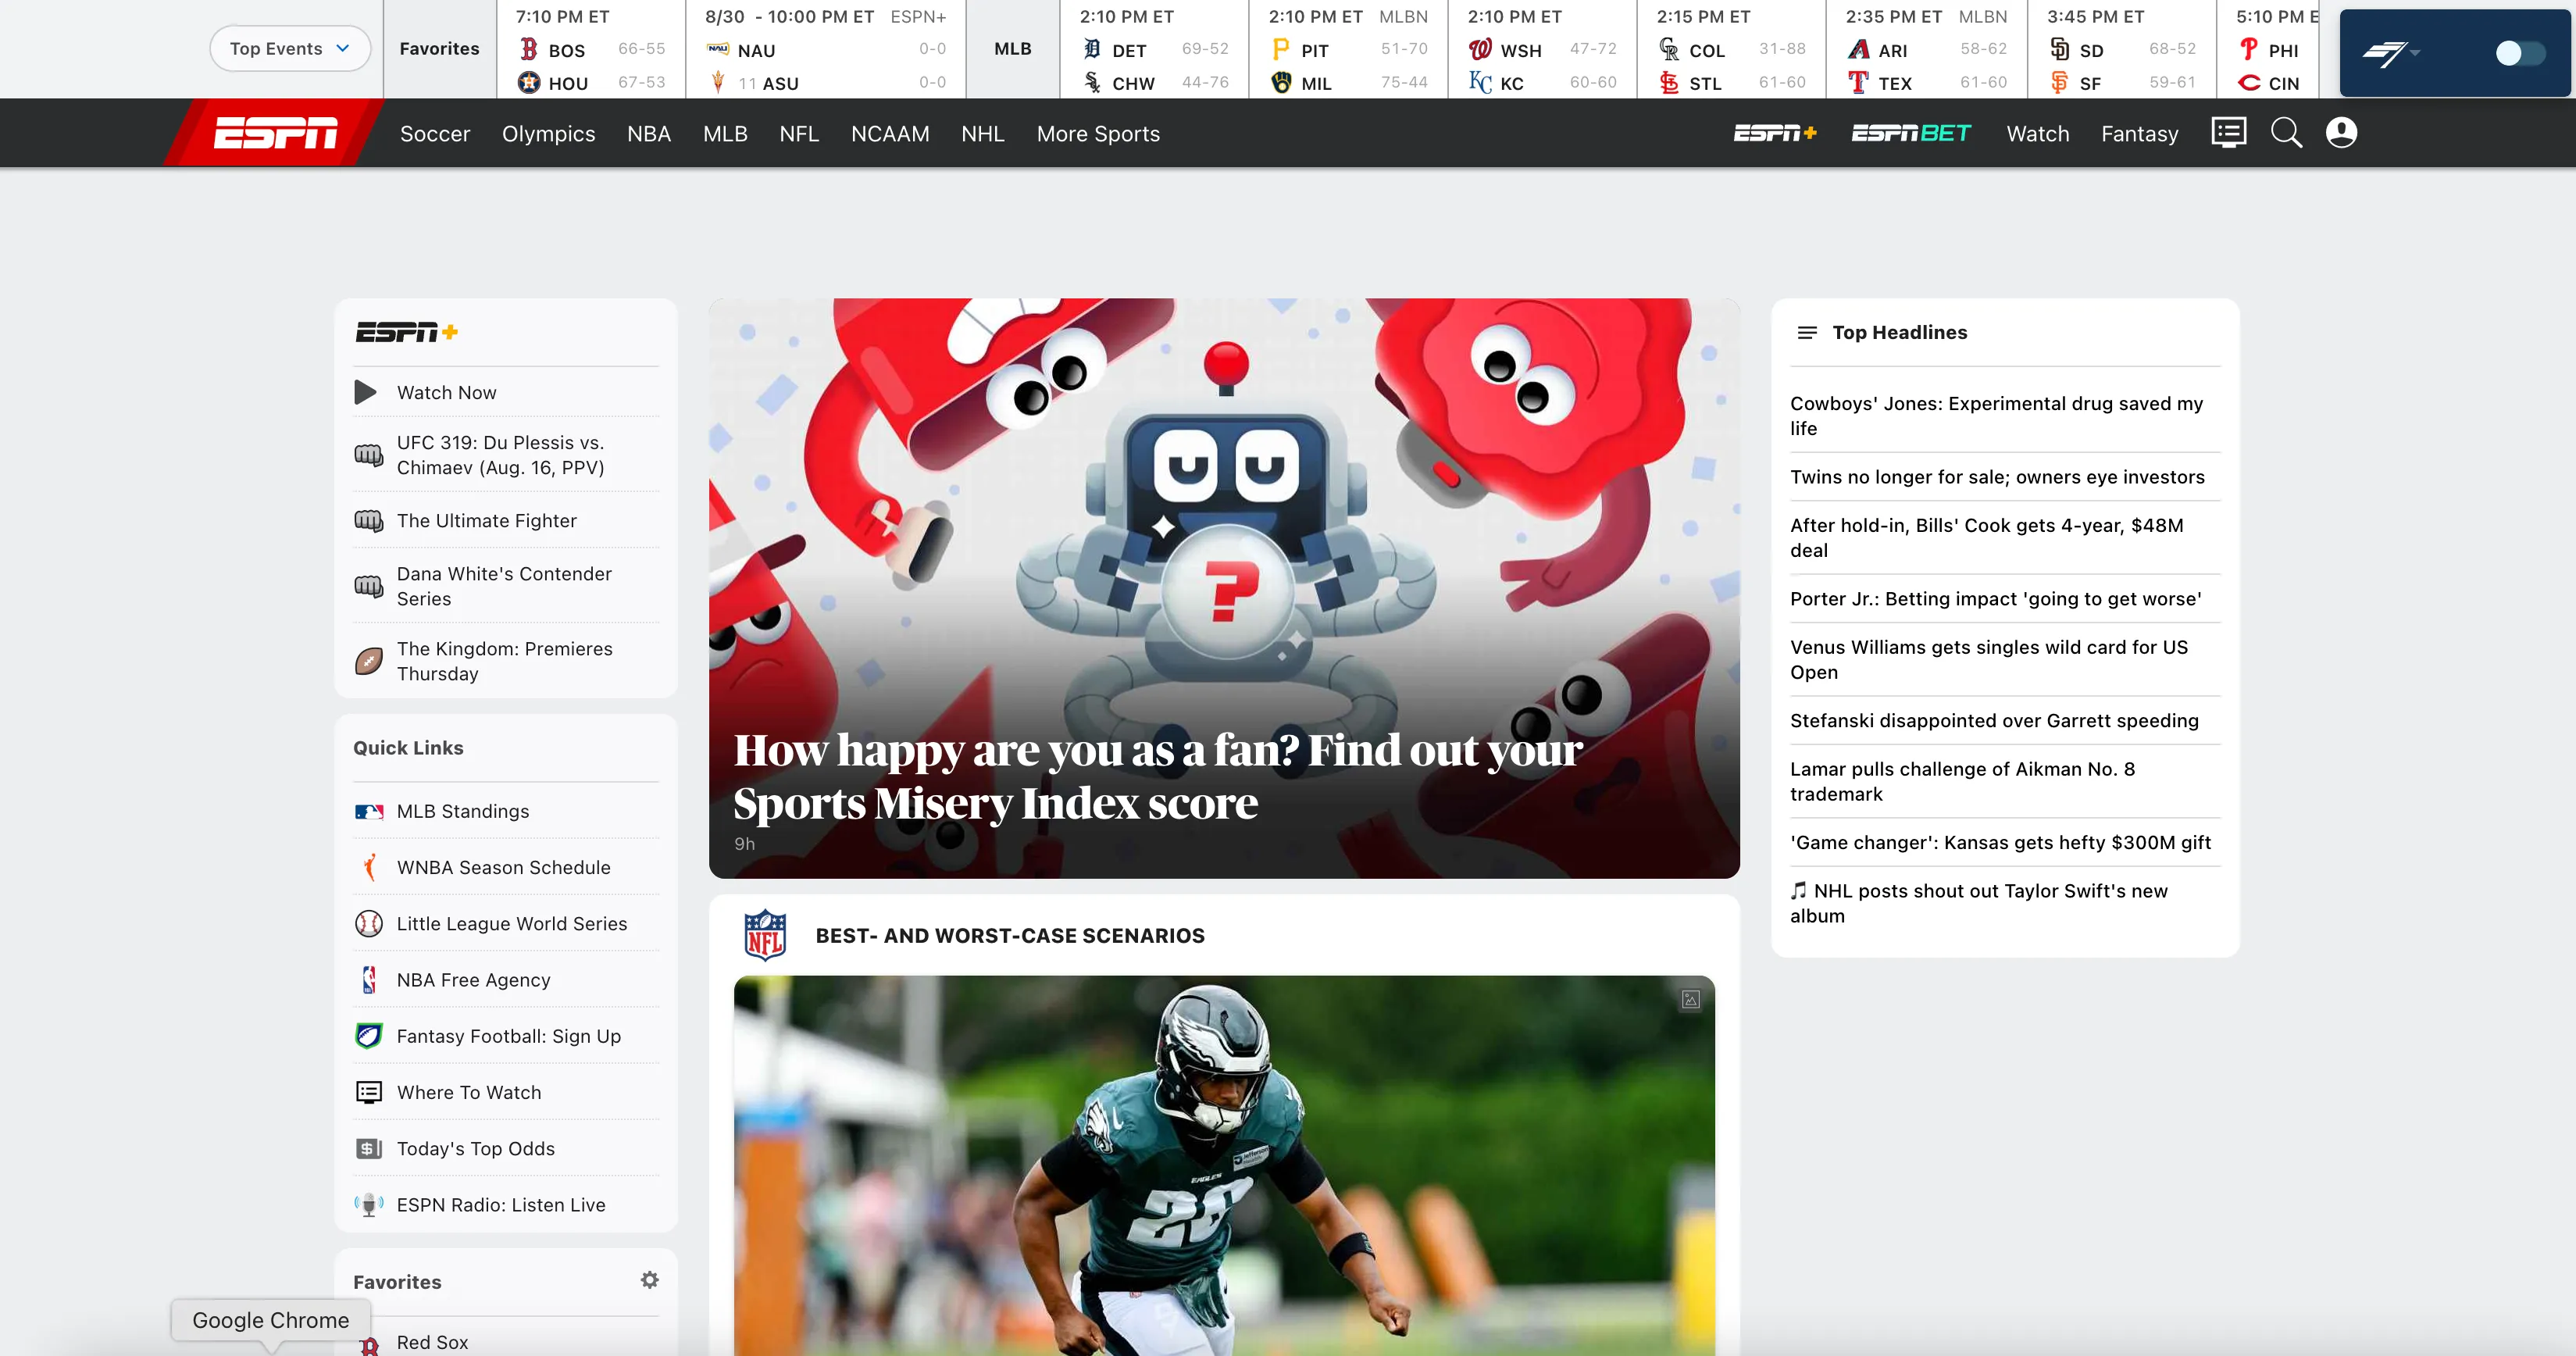
The real win was distribution: fans shared their scores to dunk on each other, which is exactly the loop it was designed for.

Coverage
- ESPN on X · Facebook · Instagram
- USA Today (For The Win) - national pickup
- Pucks and Palms - full NHL-side breakdown
- r/pacers - fans litigating their scores in the comments, as intended